Soft Launch & UA Scaling: Beauty Match Sexy 3D Triple
Most mobile game development companies deliver a build and move on. Galaxy4Games operates differently.
We develop and publish our own live titles across Google Play and the App Store, running them through real monetization models, real ad networks, and real user acquisition budgets. When a client, startup, or indie developer comes to us with a game ready for soft launch, we are not offering theoretical advice - we are sharing the same methodology we use on our own portfolio every day.
This case study covers Beauty Match: Sexy 3D Triple, one of our live titles. It documents exactly what happens after a game clears development and enters the launch pipeline: how we prepare the store presence, validate KPIs in controlled markets, select UA networks through live spend testing, and scale toward positive ROI. Every framework described here is battle-tested on titles we own and operate, not borrowed from a playbook.
Project Overview
|
|
|
|---|---|
|
Game |
Beauty Match: Sexy 3D Triple |
|
Platform |
Android (Google Play) |
|
Monetization |
In-game advertising |
|
Goal |
Positive ROI at scale |
Beauty Match: Sexy 3D Triple is a casual mobile puzzle game built around a 3D tile-matching mechanic with a mature visual theme. The business model was straightforward: monetize through in-game advertising and find user acquisition traffic that sustains a positive return on ad spend. There was no in-app purchase layer to fall back on, which meant every campaign decision had to be grounded in real eCPM and ROAS data.
This case study walks through the four pillars Galaxy4Games used to take the game from soft launch to profitable scaling: store page optimization, creative testing across multiple formats, network selection through live spend testing, and geo-level optimization using the USA as the primary scaling market. It is also a direct window into how our full-cycle game development process works in practice - from build to live operations.
The core challenge: Ad-monetized games live or die by the gap between what it costs to acquire a user and what that user generates in ad revenue. Closing that gap requires precision at every stage of the funnel - from the store listing that drives organic conversion to the creative that wins the auction.
Stage 0: Technical Launch
Before store page optimization or creative testing, there is a stage most UA guides skip entirely: the technical launch. Skipping it is expensive. Running paid traffic into a build with unresolved crashes, broken analytics, or misconfigured purchase events means every data point collected downstream is unreliable.
What Gets Validated
Three things are confirmed before any UA spend is committed:
-
Analytics integrity: Event tracking is verified end-to-end. If installs, sessions, or ad impressions are not firing correctly, ROAS calculations will be wrong from day one.
-
Crash rate: A crash rate above acceptable thresholds disqualifies a build from scaling. Users who crash before watching an ad generate zero revenue regardless of how effective the creative was.
-
Purchase events: Even for an ad-monetized title with no IAP layer, purchase event infrastructure is tested. Unity's ROAS targeting depends on revenue signal quality; a misconfigured event pipeline delays or prevents ROAS optimization from activating.
The Geo Test: Vietnam as the Entry Market
The technical launch also serves as the first live campaign test. The goal is not ROAS - it is system validation at minimal cost. The approach: identify the country with the lowest expected CPI, set a CPI target, and buy a small controlled cohort of users (typically at $10-30 spend) to run the Unity system through its two initial jobs:
-
Creative moderation - Unity reviews and approves the creative assets before they can serve at scale.
-
Creative training - The algorithm begins accumulating signal on which users engage with each creative, building the audience model that later ROAS targeting depends on.
Vietnam was the entry market for this campaign. Low CPI made it the cheapest environment to generate the install volume Unity needed to exit the training phase without burning budget.
The Geo Progression
Once the technical launch confirmed a clean build and trained creatives, the campaign moved through a deliberate geo sequence:
|
Stage |
Market |
Purpose |
|---|---|---|
|
Technical launch |
Vietnam |
Cheapest CPI, creative moderation + training |
|
Soft launch |
Germany (DE) |
Mid-tier eCPM, quality signal before Tier 1 |
|
Scaling |
USA |
Highest eCPM, primary revenue market |
|
Additional markets |
Poland (PL), Russia (RU) |
Strong recent performance for this genre |
Germany acted as a quality filter between Vietnam and the USA. If DE showed acceptable ROAS, it confirmed the creative-audience fit held in a higher-CPI, higher-eCPM environment before committing budget to the US market. Poland and Russia emerged as additional performers during the scaling phase, with RU showing particularly strong results for the beauty genre specifically.
On ROAS targeting: Unity previously required a minimum traffic volume before ROAS targeting could be enabled. That constraint has since changed; ROAS targeting can now be set from campaign launch. The technical launch geo test still serves a purpose, but the timeline to ROAS optimization is faster than it was.
Day 0 ROAS: The Decision Framework
Because Beauty Match has low retention and a short payback tail, waiting for Day 7 or Day 14 ROAS to make spend decisions is not practical. The revenue a user generates on the day they install is the primary signal. That makes Day 0 ROAS the core campaign management metric.
|
Day 0 ROAS |
Interpretation |
Action |
|---|---|---|
|
70-80%+ |
Strong performance |
Scale spend |
|
50-70% |
Acceptable, monitor closely |
Hold and watch the trend |
|
Below 50% |
Underperforming |
Give 1-2 days to learn; stop if no improvement |
The 50-70% range is not a failure state - it is a watch zone. If Day 0 ROAS in that band holds steady or trends upward as the algorithm learns, the campaign is worth keeping. If it starts to slide, that is the signal to cut before the loss compounds. Below 50%, the campaign gets a short window (one to two days) to self-correct through algorithmic learning. If it does not move, it stops.
This framework keeps decision-making fast and prevents the common mistake of holding underperforming campaigns too long while waiting for data that will not materially change the outcome.
How to read the geo ROAS data: Each row represents a country. The columns that matter most are Day 0 ROAS, spend, and installs. Markets where Day 0 ROAS sits at 70%+ with meaningful spend are candidates for scaling. The 50-70% band gets watched for a day or two to see if the trend holds. Anything below 50% that does not improve gets paused. The USA commands a higher CPI than most markets in this dataset, but the eCPM it returns justifies the cost - the ROAS column confirms whether that equation is working at any given moment.
Pillar 1: Store Page Optimization
Before a single dollar was spent on paid UA, the Google Play store page needed to convert. A weak store listing bleeds both paid and organic traffic: users click through from an ad, land on the page, and leave without installing. That wasted click raises effective CPI across every network running traffic.
ASO Testing Before Committing to a Final Page
Store page elements are not set once and left alone. We run structured A/B tests on icons, preview videos, and screenshots to measure conversion lift before locking in a final page. The results below are from the Beauty Match launch - each variant was measured against install rate from real traffic, with 50/50 splits and statistical confidence intervals to separate signal from noise.
Icon Test: Icon_V7 vs. Control
The icon test ran a 50/50 split between the existing icon (control) and a new design (Icon_V7). The results were unambiguous:
|
Variant |
Users Who Installed |
Estimated Total Installs |
|---|---|---|
|
Control (current icon) |
508 |
1,016 |
|
Icon_V7 |
704 |
1,408 |
Effectiveness came in at +9.7% to +66.9% lift at 90% confidence - a fully positive interval with no overlap at zero. The cumulative install curve for Icon_V7 diverged from the control immediately after launch and widened consistently over time, ruling out random variation. One icon change produced a statistically significant improvement in store conversion before a single dollar of UA spend was adjusted.
Video Test: Multi-Variant Preview Test
The video test ran four variants at 25% traffic each - Control, Business 1, Sport 2, and Holiday 3. The outcome was different:
|
Variant |
Current Installs |
Estimated Installs |
Effectiveness |
|---|---|---|---|
|
Control |
4,299 |
17,196 |
Baseline |
|
Business 1 |
4,430 |
17,720 |
-5.1% to +11.1% |
|
Sport 2 |
4,363 |
17,452 |
-5.4% to +8.3% |
|
Holiday 3 |
4,576 |
18,304 |
+0.9% to +12% |
All four growth curves tracked closely together. Holiday 3 was the marginal leader, but confidence intervals for most variants crossed zero - meaning the differences could be noise. The correct call here is not to declare a winner and ship; it is to extend the test or reframe the creative hypothesis.
What these two tests show together: Icons tend to generate fast, high-confidence results because they are the first visual filter in a scroll environment. Video effects are subtler and require larger sample sizes or longer run times to reach the same confidence threshold. Treating both asset types the same way leads to either premature decisions on video or missed wins on icons.
This testing step is part of the standard launch preparation Galaxy4Games runs for every title - both our own and client projects. A store page that has not been tested is a conversion rate assumption, not a data point.
What Was Optimized
The optimization focused on three elements:
-
App icon: Redesigned to lead with the game's core visual hook - communicating genre and tone immediately in a competitive, scroll-heavy environment.
-
Screenshots: Replaced generic gameplay captures with a curated sequence showing the tile-matching mechanic, the 3D character visuals, and the progression loop within the first two frames. Screenshots function as a second ad unit; most users scan them before deciding to install.
-
Short description: Rewritten to front-load genre keywords and the value proposition in the first line, since Google Play truncates this text aggressively on mobile.
Why This Comes First
Store page conversion rate (CVR) is a multiplier on every UA channel. Improving CVR from 25% to 35% on a campaign spending $1,000/day effectively delivers the same result as cutting CPI by 28%, without touching bids or creatives. For an ad-monetized title where margin is thin, this leverage matters before scaling spend.
Pillar 2: Creative Testing
With the store page ready, the next step was identifying which creatives could drive installs at a CPI that leaves room for positive ROAS on an ad-monetized model. Multiple creative packs were built and run simultaneously across networks to generate real performance data, not assumptions.
Creative Pack Performance
The table below shows comparative results across tested creative packs, including spend, installs, eCPM, CVR, clicks, and CTR:
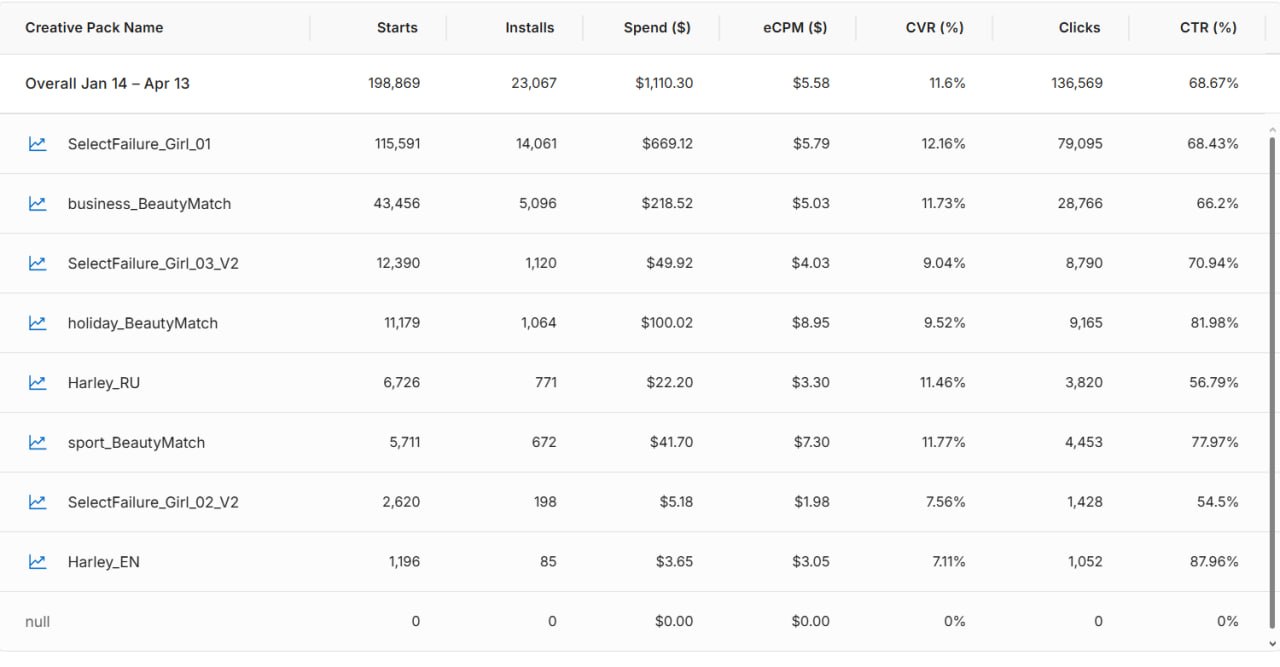
What the Data Showed
Several clear patterns emerged from the creative test results:
-
eCPM variance was significant across packs. Higher eCPM creatives attracted better-quality placements, which fed back into stronger install rates.
-
CVR was the primary differentiator between packs. Creatives with similar CTR could produce very different install volumes depending on how well they set expectations for the store page experience.
-
CTR alone was a misleading signal. Some high-CTR creatives underperformed on installs - they attracted clicks from users who bounced on the store page. Winning creatives aligned CTR with CVR.
How the Data Was Read
Retained for scaling:
-
Failure Girl 1 - Strong install volume combined with a healthy CVR made this the clearest winner. High starts translated into actual installs, confirming the creative attracted users with genuine intent rather than idle clicks.
-
Business Beauty Match - Solid volume and conversion held up together, indicating the creative set expectations the store page could fulfill.
Cut from scaling:
-
Failure Girl 2 v2 - Both install volume and CVR dropped relative to retained creatives. Click intent and install intent were misaligned.
-
Harley - Same pattern. Lower volume and weaker conversion meant the creative pulled in users who were not sufficiently motivated to complete the install. Continuing spend here would have raised blended CPI without improving ROAS.
The rule applied consistently: volume and CVR had to move together. A creative that drove clicks but lost users at the store page was not a traffic problem - it was a creative-audience fit problem.
Key takeaway: In ad-monetized games, the creative's job is not just to get the click. It is to attract the user who will watch ads. A cheap install from a user who churns in 60 seconds is worth less than a more expensive install from a user who completes sessions and generates eCPM revenue.
Pillar 3: Network Selection
Three networks were tested during the soft launch phase: Unity Ads, Facebook, and Mintegral. Each received real budget allocation and was evaluated on the same criteria: CPI, install quality (measured by downstream ad revenue), and ROAS trajectory over time.
How the Test Was Structured
The same winning creatives were used across all three networks to isolate network performance as the variable, rather than creative quality.
|
Network |
Tested |
Retained |
Primary Signal for Decision |
|---|---|---|---|
|
Unity Ads |
Yes |
Yes |
Lowest CPI, strongest ROAS in target geos |
|
|
Yes |
No |
Higher CPI, weaker ROAS on ad-monetized cohorts |
|
Mintegral |
Yes |
No |
Higher CPI, lower install quality for this title |
Why Unity Ads Won
For this title, Unity Ads delivered the best CPI and ROAS combination across the tested geos. This is not a universal recommendation - network performance varies by genre, creative format, and target geography. The only reliable way to find the winning network for a specific title is to test with real budget and let the data decide.
The decision rule: Run all candidate networks simultaneously with the same creatives, measure ROAS by cohort, and consolidate budget into whichever network wins. Do not split budget equally out of habit.
Pillar 4: Geo-Level Optimization and USA Scaling
Once Unity Ads was confirmed as the primary network and the winning creative set was locked in, the focus shifted to geography. Not all markets deliver equal ROAS for an ad-monetized game. eCPM rates vary dramatically by country, and the gap between a Tier 1 market like the USA and a Tier 3 market can be 10x or more in terms of ad revenue per user.
How Top-Performing Countries Were Identified
The process started broad: campaigns ran across multiple geographies to collect install volume and early retention signals. Countries were then ranked by a composite score combining:
-
CPI relative to local eCPM rates (the core profitability signal)
-
Day 1 and Day 7 retention (users who churn before watching ads generate no revenue)
-
Session length and ad engagement rate (frequency of ad impressions per active user)
Markets where the CPI-to-eCPM ratio produced a positive ROAS trajectory within the first week were prioritized for budget increases. Markets where CPI was low but user quality was poor were deprioritized regardless of install volume.
Optimization Loop
Scaling in top-performing countries followed a continuous optimization loop rather than a one-time budget increase:
-
Creative rotation: New variants introduced regularly to combat fatigue and maintain CTR as spend increased.
-
Bid adjustment: As the algorithm accumulated data on converting users, bids were refined to favor placements that historically produced higher-value installs.
-
Audience signal refinement: Unity Ads' machine learning optimized toward users with the strongest ad engagement history, reducing wasted spend on low-quality installs over time.
-
ROAS monitoring by cohort: Each weekly cohort of new installs was tracked against its ROAS curve to catch any deterioration in user quality before it became a budget problem.
The result: positive ROI was achieved and maintained in several geos, with the optimization loop allowing spend to scale without a proportional increase in CPI or decline in ROAS.
Key Takeaways
The Beauty Match: Sexy 3D Triple campaign demonstrated that profitable scaling for an ad-monetized mobile game is achievable without in-app purchases, provided the methodology is disciplined and data-driven at every stage. The four pillars worked as a system, not as independent tactics.
What Made This Work
-
Store optimization before spend. Fixing CVR at the store page level - including structured ASO testing - reduced effective CPI across all paid channels before any budget was committed to UA.
-
Creative testing with the right success metric. Evaluating creatives on CPI and downstream ROAS rather than CTR alone prevented budget from flowing to high-click, low-quality installs.
-
Network consolidation based on evidence. Testing three networks simultaneously and concentrating budget on the winner accelerated learning and improved bid efficiency.
-
Geo prioritization by CPI-to-eCPM ratio. Identifying the USA as the primary scaling market based on user quality metrics - not just install volume - ensured that increased spend translated into increased revenue rather than just increased traffic.
The Repeatable Framework
|
Stage |
Action |
Success Signal |
|---|---|---|
|
Pre-launch |
Store page ASO testing + CVR optimization |
Install rate from paid traffic |
|
Soft launch |
Creative pack testing across networks |
CPI + downstream ROAS |
|
Network selection |
Budget consolidation to winner |
ROAS by cohort |
|
Scaling |
Geo prioritization + creative rotation |
Sustained positive ROI |
The specifics - choice of network, creatives, benchmarks - change by genre and audience, but the sequence and decision logic remain consistent. It is also the same process Galaxy4Games applies when partnering with external developers and studios, because we run it on our own titles first.
Work With a Team That Has Skin in the Game
Most game development outsourcing companies have never spent their own money acquiring users for a mobile game. Galaxy4Games has. We operate live titles, manage real ad budgets across multiple networks, and iterate on the same frameworks we share with clients - across different monetization models and app stores.
When you bring us in for mobile game development outsourcing and launch, you are not getting a service provider who disappears after delivery. You are getting a partner who has run this exact process on their own portfolio and knows where it breaks down.

What we can help with:
-
Full-cycle game development
-
Store page preparation and ASO testing before any paid spend
-
KPI framework setup and soft launch market selection
-
Creative production and multi-network testing
-
UA scaling and geo-level ROAS optimization
-
LiveOps game development outsourcing and performance monitoring post-launch
If your game is approaching soft launch and you need a partner who understands what comes after the build is done, get in touch for a free consultation. We will review your title's launch readiness and map out a growth strategy grounded in what actually works.